|
1850
Total white population 154,034
Female
69,165
Male
84,869
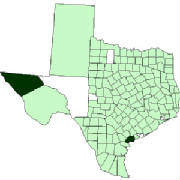
Highest
8,469
area now made up of
Cameron, Starr and Webb
counties in south Texas
Total free African American 397
population
Female
186
Male
211
Highest
63
Jefferson County
Lowest 51 counties reported 1 or less
For slave information see the Slavery Statistics page
Persons born outside 17,690
the US
Search the US census data for specific countries of origin
|
 |
|
1860
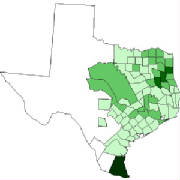
Total white population 420,891
Female 192,306
Male 228,585
Highest
13,057
Bexar County
Lowest
26
Zavala County
Native-born
377,893
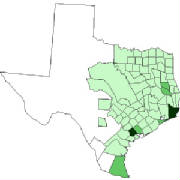
Foreign-born 43,401
Total free African American 355
population
Female 174
Male 181
Highest 66
Cameron County
Lowest 119 counties reported 1 or less
Native-born
78
Foreign-born
4
For slave information see the Slavery Statistics page
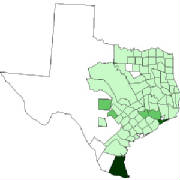
Total Indians
403
Highest
196
El Paso County
Lowest
1
Falls and Burleson counties
| Indian Population Density 1860 |
|
| The darker colors represent a higher density of population |
|
|
|
|
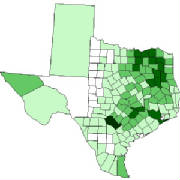
| White Population Density 1850 |
|
| The darker colors represent a higher density of population |
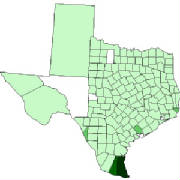
| Free African American Population Density 1850 |
|
| The darker colors represent a higher density of population |
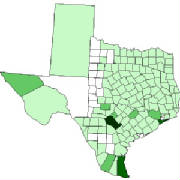
| Foreign Born 1850 |
|
| The darker colors represent a higher density of population |
|
|
|
| White Population Density 1860 |
|
| The darker colors represent a higher density of population |
| Foreign-born Population Density 1860 |
|
| The darker colors represent a higher density of population |
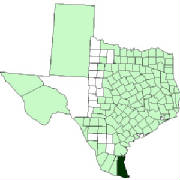
| Free African American Population Density 1860 |
|
| The darker colors represent a higher density of population |
| Free African American Foreign-born |
|
| The darker colors represent a higher density of population |
|
|


